Dashboard: billing indicators panel
The "Dashboard" is the main screen of BillingBot. As soon as you enter the application you land here, and it shows you at a glance how your billing for the month is going: how much you're billing, how much you're earning, which clients a...
Last updated 24 days ago
The "Dashboard" is the main screen of BillingBot. As soon as you enter the application you land here, and it shows you at a glance how your billing for the month is going: how much you're billing, how much you're earning, which clients are most profitable, how much you still have to bill, and how healthy your billing operation is. All the data you see comes from the charges you've already processed in BillingBot (Pax8 is not queried live every time you open the screen), which is why the information is cached and may take a few seconds to update.
When to use this screen
- At the start of the day, to review the general state of the month's billing before diving into the details.
- When you want to compare the current month against the previous one (billing, profit, clients).
- To quickly detect whether there are pending charges to invoice or recent errors that need attention.
- Before an internal meeting or one with a client, to have the key numbers on hand.
What it shows
Header
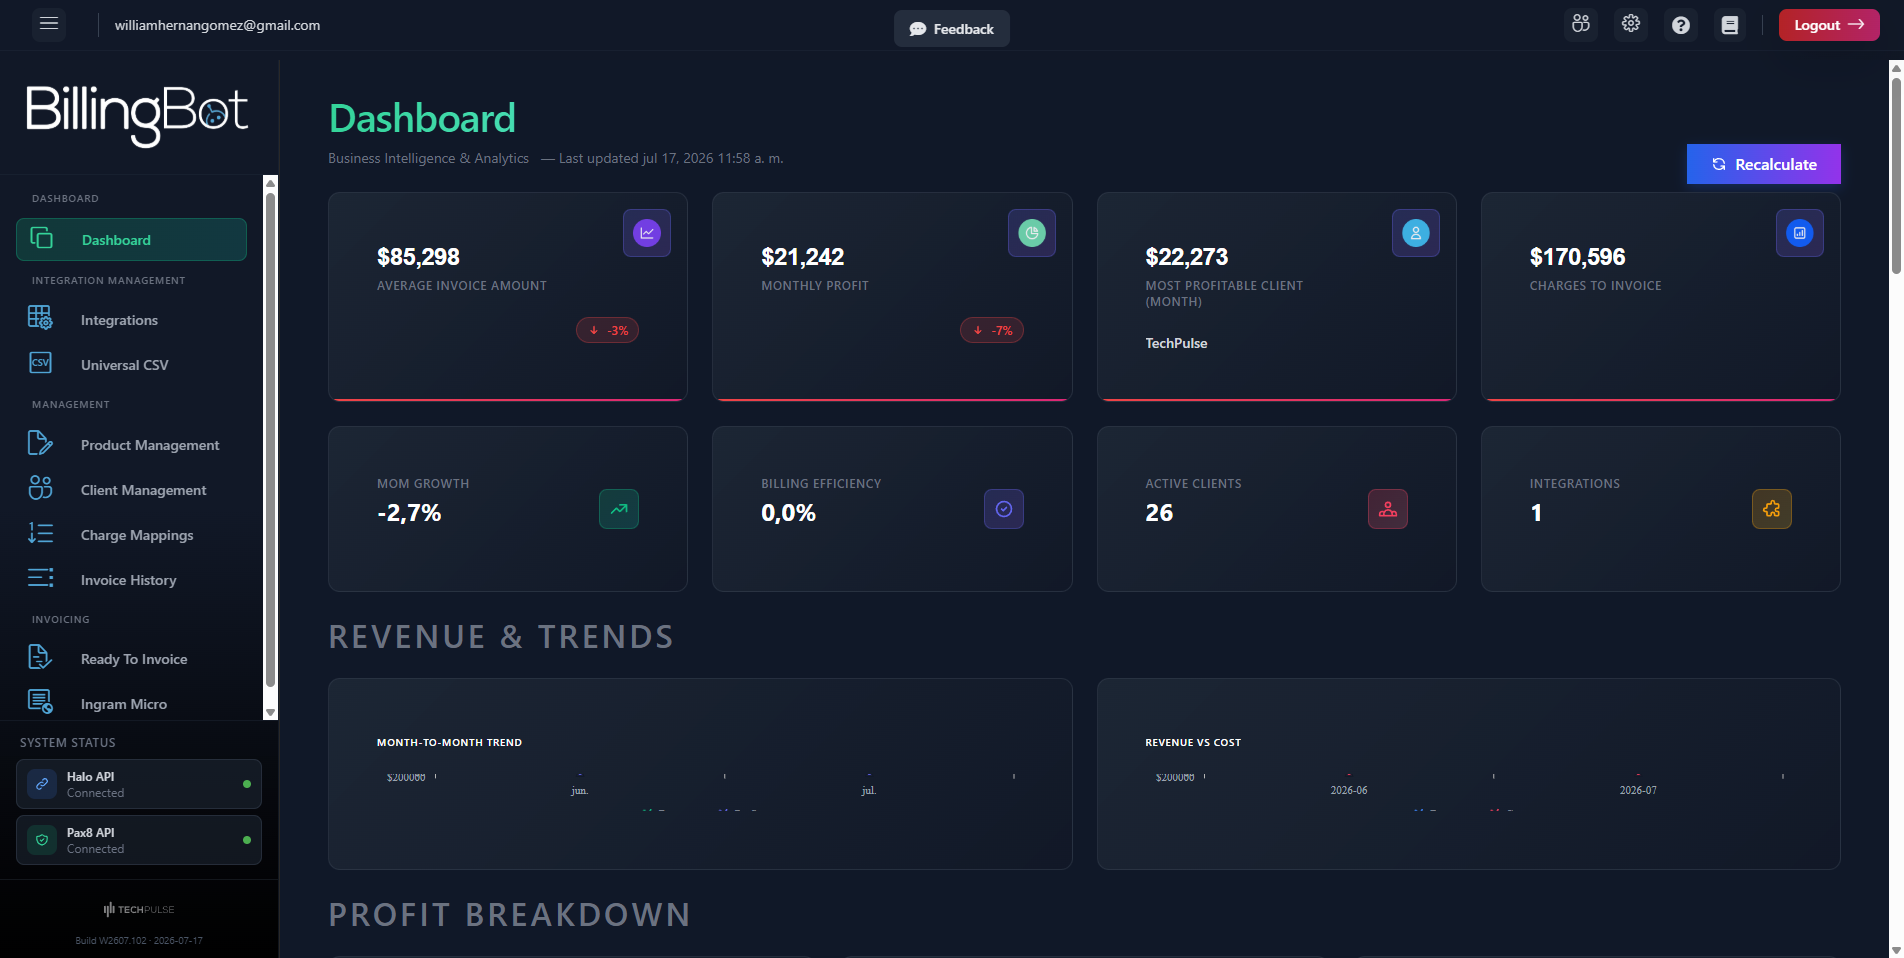
- Title "Dashboard" with the subtitle "Business Intelligence & Analytics".
- Date and time of the last data update (for example "Last updated Jul 17, 2026 9:30 AM"), if it has been calculated at least once.
Main cards (KPIs)
Four cards with the indicator's value, the associated name (when applicable), and a percentage of change against the previous period (green arrow up if it improves, red arrow down if it worsens):
- Average Invoice Amount: the average amount of your invoices.
- Monthly Profit: the month's profit (revenue minus costs) calculated on your already processed charges.
- Most Profitable Client (Month): the client that generated the most profit for you in the month; the client's name appears below the amount.
- Charges to Invoice: total value of charges that are already ready but have not yet been invoiced.
Secondary indicators
Four additional small cards:
- MoM Growth: percentage of growth from one month to the next (Month over Month).
- Billing Efficiency: billing efficiency percentage.
- Active Clients: number of active clients in the most recently recorded month.
- Integrations: number of integrations with revenue data available.
Revenue and trends
- Month-to-Month Trend: line chart comparing, month by month, your revenue ("Revenue") against your profit ("Profit").
- Revenue vs Cost: chart comparing revenue against costs month by month; if there is not yet enough data, it shows a "coming soon" message.
Profit breakdown
- Profit by Company: pie chart with profit broken down by client/company.
- Profit per SKU: donut chart with profit broken down by product (SKU).
- Invoice Status: donut chart with the distribution of your invoices by status; if there is no data, it shows a "coming soon" message.
Integrations and charge aging
- Revenue by Integration: bar chart with the revenue contributed by each integration (Pax8, Halo, Ingram, etc.); if there is no data, it shows a "coming soon" message.
- Charges Aging: column chart with charges grouped by age (how long they have gone without being invoiced); if there is no data, it shows a "coming soon" message.
Client analysis
- Active Clients Trend: area chart with the evolution of the number of active clients month by month; if there is no data, it shows a "coming soon" message.
- Top Clients by Revenue: table with your highest-revenue clients, showing Revenue, Cost, Margin (profit in money), and the margin percentage. The percentage appears in green if it is 20% or more, and in amber if it is lower.
Extended analytics (under construction)
A row of cards — Margin Trend, Revenue Forecast, Client Churn Risk, SKU Growth Rate, Invoice Processing Time, Top SKU Performers, Client Profitability Heatmap, Cost Breakdown, Billing Cycle Overview, and Dispute & Error Tracking — that don't have data yet and show the message "coming soon". These are placeholders for future metrics.
Billing Health
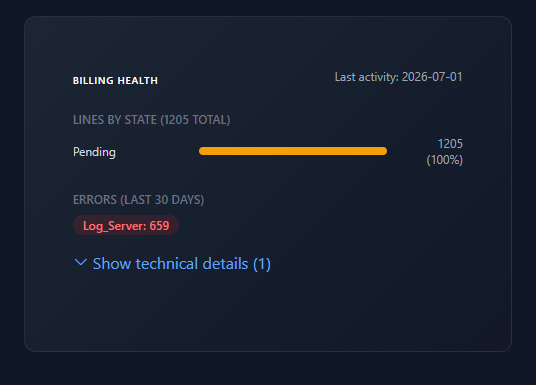
Read-only card with the actual status of your charges:
- Lines by state: bars showing how many of your processed charges are in each state (for example Invoiced, In Queue/Pending, Not Invoiced), with the total number of lines and the percentage for each state. The bar's color indicates whether it's a good sign (green = invoiced), a waiting sign (amber = in queue/pending), or an alert (red = not invoiced).
- Errors (last N days): labels with the number of errors by type that occurred in recent days. If there are no errors, a reassuring message is shown ("No errors in this period").
- Show technical details: link to expand the detail of each recent error (date, type, source, and message). Useful if you need to report something specific to support.
- The date of the last recorded activity is shown ("Last activity").
- Integrity checks (since a period): read-only checks over the last three periods that look for signs of billing problems in your data. Each finding says what it means, how many cases and how much money are involved, what to do, and up to five examples (client, period, product). Findings marked Money at risk need attention before your next send; To review ones may be correct and only need checking. If nothing is found you will see "No integrity problems found". The checks are:
- Pending charges that are already billed in HaloPSA — do not queue them: they would be billed twice. Contact support.
- Charges stuck "In Queue" — no queued line will send them.
- Credits that would be billed as charges — do not send them as they are.
- An earlier month was sent after a later one — check the recurring invoice in HaloPSA.
- Recurring invoices with no charges this month — HaloPSA keeps billing last month's lines; use Review Recurring Invoices in Ready to Invoice. The check is made per invoice, with the same rule as Review Recurring Invoices: excluded charges, clients marked Do Not Invoice and charges going to another invoice do not count as charges for it. Early in the month this can simply mean the charges are not imported yet.
- Lines in HaloPSA that BillingBot no longer recognises — review them in the recurring invoice; some may still be correct. Use Review Recurring Invoices to remove leftovers, or remove them in HaloPSA. Lines that a clean (or a send) already removed are no longer reported.
- Backup restores that did not finish — the invoice was put back in HaloPSA but its charges still look sent; restore the same backup again in Invoice History.
Available actions
- "Recalculate": recalculates all the dashboard's indicators and charts with the most recent data from your processed charges, without waiting for them to update automatically. While recalculating, the button shows "Recalculating..." and you cannot click it again. This is not an irreversible action: it only refreshes the numbers you see, it does not modify invoices or charges.
- Show technical details / Hide technical details on the Billing Health card: expands or collapses the list of recent errors. It only changes what you see on screen.
Step-by-step flow
- Go to "Dashboard" from the main menu (or it is the screen the application opens with).
- Wait for it to load ("Loading your dashboard, this may take a minute...").
- Review the KPI cards for the month's summary: average invoice, profit, most profitable client, and charges pending invoicing.
- Scroll through the chart sections to review trends, profit breakdown by client/SKU, invoice status, revenue by integration, and pending charge aging.
- Check the "Top Clients by Revenue" table to identify your most important clients and their margin.
- Check the "Billing Health" card at the end to see if there are stuck charges or recent errors you need to address.
- If you just invoiced or processed charges and want to see the updated numbers right away, click "Recalculate".
Common errors and how to resolve them
- "Error loading dashboard: ...": the dashboard could not load the data when opening the screen. Try reloading the page; if it persists, contact support with the message detail.
- "ERROR in ..." when recalculating: the recalculation could not complete. Try again with "Recalculate"; if the error repeats, report it to support with the exact message.
- "Error recalculating dashboard: ...": an unexpected problem occurred when clicking "Recalculate". Try again in a few minutes.
- "Could not load billing health. Please try again later.": the billing health card could not fetch its data. It does not affect the rest of the dashboard; refresh the page later to try again.
- If you see "coming soon" or "will appear here once available" messages on any chart, it is not an error: it means there is not yet enough historical data, or that metric is still in development.
Related screens
Was this helpful?
Still need help? Ask the team